Connecting ClickHouse to a Node.js Backend — A Practical Guide to Real-Time Aggregation APIs for Hundreds of Millions of Events
One day, a notification pops up in the team channel: "Dashboard loading is taking over 30 seconds." As the rows in the events table surpassed 500 million, PostgreSQL's GROUP BY queries started timing out. We tried adding indexes and partitioning, but the data kept accumulating and queries kept getting slower. That's when we first took a serious look at ClickHouse.
ClickHouse is a column-oriented OLAP database. Unlike PostgreSQL, which stores data row by row, ClickHouse stores each column in a separate file. For an analytical query that reads only 5 out of hundreds of columns, there is zero disk I/O for the remaining columns. Thanks to its SIMD-based vectorized engine, it can scan hundreds of millions of rows per second on a single server, and the Materialized View + AggregatingMergeTree pattern can return pre-aggregated results in milliseconds.
This article covers building an event ingestion pipeline using the official @clickhouse/client in a Node.js backend and creating a real-time aggregation API. We'll walk through schema design, batch INSERT optimization, SQL injection prevention, and large result set streaming — the pitfalls you encounter in actual production environments.
Core Concepts
Why Column Storage Is Faster for Analytical Queries
When you run SELECT event_type, COUNT(*) FROM events GROUP BY event_type on a row-oriented database, the engine must read every row. Columns like user_id, page_url, and properties are bundled in the same row even though they have nothing to do with the query, so they get read from disk along with everything else.
ClickHouse only needs to open the event_type column file. Because values of the same type are stored consecutively, LZ4 and ZSTD compression ratios are high. You can expect 3–10x compression compared to the original, which also reduces storage costs.
| Item | PostgreSQL (row-oriented) | ClickHouse (column-oriented) |
|---|---|---|
| Scan target | All rows of all columns | Only the columns needed by the query |
| Compression ratio | Low (mixed heterogeneous data) | High (consecutive homogeneous data) |
| Analytical query speed | Degrades linearly as row count grows | Relatively independent of column count |
| OLTP UPDATE/DELETE | Efficient | Inefficient (mutation operations) |
MergeTree — How Data Is Stored on Disk
ClickHouse's default storage engine, MergeTree, is based on the LSM tree concept. Data is written to disk in sorted "parts," and a background process continuously merges those parts.
The sparse primary index records only one index point every 8,192 rows, using almost no memory while still narrowing the desired data range to milliseconds. The key point is that the choice of ORDER BY columns directly determines query performance. The rule is to place columns that frequently appear in WHERE clauses of analytical queries toward the front of ORDER BY.
Repeatedly inserting small batches causes the number of parts to explode. The "Too many parts" error is the most common problem newcomers encounter with ClickHouse, and it can be resolved with batch INSERTs — we'll look at this in detail with code later.
Materialized View + AggregatingMergeTree — Pre-baking Aggregations
This is the core pattern for real-time aggregation APIs. When data is INSERTed into the source events table, the Materialized View is automatically triggered and saves intermediate aggregation state to a separate table. When the API queries, it only reads the pre-aggregated table instead of hundreds of millions of raw records. Millisecond-level response times are possible because we're reading from this pre-aggregated table — not aggregating hundreds of millions of raw records in real time.
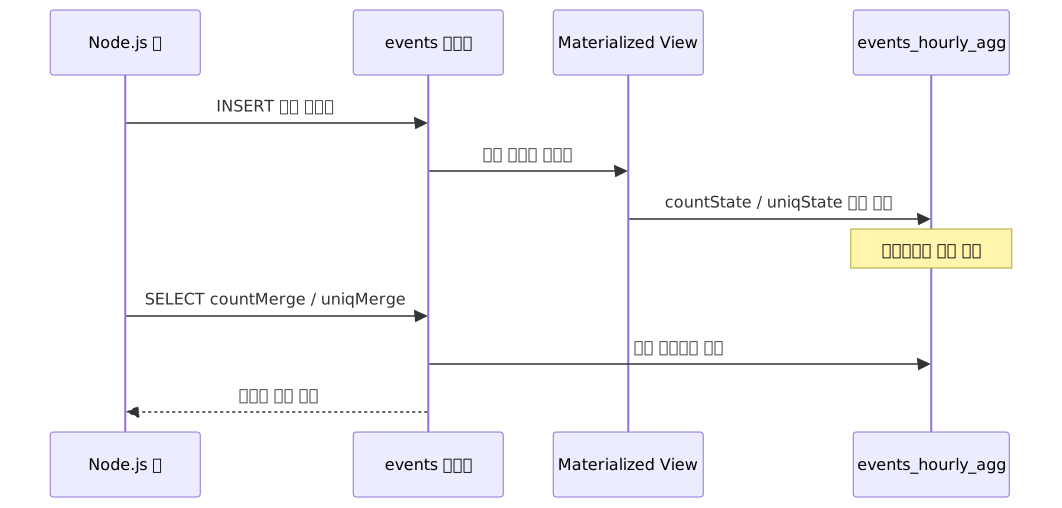
AggregatingMergeTree stores intermediate aggregation states (countState, uniqState, etc.) and automatically combines them during merges. When querying, you use countMerge and uniqMerge to extract the final values.
Practical Application
Let's look at the overall architecture first. When a user event occurs, the Node.js ingester buffers it and sends a batch INSERT, which immediately triggers the Materialized View to update the aggregation table. The analytics API queries only the aggregation table and returns results to the dashboard.

Step 1: Client Initialization and Connection Pool Configuration
npm install @clickhouse/client// src/db/clickhouse.ts
import { createClient } from '@clickhouse/client'
export const clickhouse = createClient({
url: process.env.CLICKHOUSE_URL ?? 'http://localhost:8123',
username: process.env.CLICKHOUSE_USER ?? 'default',
password: process.env.CLICKHOUSE_PASSWORD ?? '',
database: 'analytics',
max_open_connections: 20,
keep_alive: {
enabled: true,
idle_socket_ttl: 2000,
},
request_timeout: 30_000,
})idle_socket_ttl is a setting that's easy to miss until you read the documentation carefully. If the keepalive timeout of AWS ALB or Nginx is set lower than this value, the server will close the connection first, causing intermittent socket errors. Check the load balancer's keepalive timeout in your production environment and set this value lower than that.
Step 2: Designing the Events Table and Aggregation Structure
-- Source events table
CREATE TABLE IF NOT EXISTS analytics.events
(
    event_id   UUID                  DEFAULT generateUUIDv4(),
    user_id    String,
    event_type LowCardinality(String),
    page_url   String,
    timestamp  DateTime64(3)         DEFAULT now64(),
    properties String
)
ENGINE = MergeTree()
PARTITION BY toYYYYMM(timestamp)
ORDER BY (event_type, user_id, timestamp);

-- Hourly aggregation results table
CREATE TABLE IF NOT EXISTS analytics.events_hourly_agg
(
    event_type   LowCardinality(String),
    hour         DateTime,
    event_count  AggregateFunction(count),
    unique_users AggregateFunction(uniq, String)
)
ENGINE = AggregatingMergeTree()
PARTITION BY toYYYYMM(hour)
ORDER BY (event_type, hour);

-- Materialized View that triggers automatically on events INSERT
CREATE MATERIALIZED VIEW IF NOT EXISTS analytics.events_hourly_mv
TO analytics.events_hourly_agg
AS
SELECT
    event_type,
    toStartOfHour(timestamp) AS hour,
    countState()             AS event_count,
    uniqState(user_id)       AS unique_users
FROM analytics.events
GROUP BY event_type, hour;
LowCardinality(String) applies dictionary encoding, improving storage space and query speed for columns like event_type that have dozens to hundreds of distinct values. Storing the properties column as a JSON string and parsing it with the JSONExtract function at query time strikes a good balance between schema flexibility and performance.
ORDER BY (event_type, user_id, timestamp) is chosen to match the query pattern in this example (WHERE event_type = ? AND timestamp BETWEEN ?). If your actual service has different analytical query patterns, the ORDER BY design should change accordingly.
Step 3: Preventing Part Explosion with Batch INSERTs
Batch INSERT and async_insert solve different problems.
- Batch INSERT: The client bundles multiple events and sends them in a single request. This is the most direct way to reduce the number of parts created.
- async_insert: Even if the client sends individual INSERTs one at a time, the server buffers them until a certain condition is met before merging. This is useful when modifying client code is difficult.
If you're already batching on the client side, there's no need to add async_insert. We'll use the client-side batching approach here.
In Node.js, a common pattern is to accumulate events in an in-memory buffer and flush when either "5,000 events reached" or "2 seconds elapsed" — whichever comes first.

// src/services/event-ingester.ts
import { clickhouse } from '../db/clickhouse'

interface EventPayload {
  user_id: string
  event_type: string
  page_url: string
  properties: Record<string, unknown>
}

const buffer: EventPayload[] = []
let flushTimer: ReturnType<typeof setTimeout> | null = null
let isFlushing = false

const FLUSH_INTERVAL_MS = 2_000
const FLUSH_BATCH_SIZE  = 5_000

async function flush() {
  if (isFlushing || buffer.length === 0) return
  isFlushing = true

  const batch = buffer.splice(0, buffer.length)

  try {
    await clickhouse.insert({
      table: 'analytics.events',
      values: batch.map((e) => ({
        ...e,
        properties: JSON.stringify(e.properties),
      })),
      format: 'JSONEachRow',
    })
  } catch (err) {
    // Restore the batch to the front of the buffer on INSERT failure
    buffer.unshift(...batch)
    console.error('[event-ingester] INSERT failed, restoring batch:', err)
  } finally {
    isFlushing = false
  }
}

function scheduleFlush() {
  if (flushTimer) return
  flushTimer = setTimeout(() => {
    flushTimer = null
    flush().catch((err) => console.error('[event-ingester] flush error:', err))
  }, FLUSH_INTERVAL_MS)
}

export function trackEvent(event: EventPayload) {
  buffer.push(event)
  if (buffer.length >= FLUSH_BATCH_SIZE) {
    if (flushTimer) {
      clearTimeout(flushTimer)
      flushTimer = null
    }
    flush().catch((err) => console.error('[event-ingester] flush error:', err))
  } else {
    scheduleFlush()
  }
}
The isFlushing flag prevents duplicate execution even if the size condition and timer condition trigger simultaneously. On INSERT failure, the batch extracted with splice is pushed back to the front of the buffer to allow a retry opportunity.
One important limitation to note: this approach loses all in-memory buffer data on process restart. For pipelines where data loss is unacceptable, consider a design with a durable queue like Kafka or Redis Streams in front of the ingester.
Step 4: Preventing SQL Injection — Using query_params
Interpolating user input directly into query strings makes your code vulnerable to SQL injection. Using @clickhouse/client's query_params sends the parameters to the server as URL query strings (in the format param_<n>=), and the server substitutes them according to the declared type. While the implementation differs from prepared statements in RDBMS, the security effect is the same — it blocks any path where user input could be interpreted as SQL syntax.
// src/api/analytics.ts
import { clickhouse } from '../db/clickhouse'

interface HourlyStats {
  hour: string
  event_count: string
  unique_users: string
}

export async function getHourlyStats(
  eventType: string,
  fromHour: Date,
  toHour: Date,
): Promise<HourlyStats[]> {
  const result = await clickhouse.query({
    query: `
      SELECT
        hour,
        countMerge(event_count)  AS event_count,
        uniqMerge(unique_users)  AS unique_users
      FROM analytics.events_hourly_agg
      WHERE event_type = {eventType: String}
        AND hour BETWEEN {fromHour: DateTime} AND {toHour: DateTime}
      GROUP BY hour
      ORDER BY hour ASC
    `,
    query_params: {
      eventType,
      fromHour: toClickHouseDateTime(fromHour),
      toHour:   toClickHouseDateTime(toHour),
    },
    format: 'JSONEachRow',
  })

  return result.json<HourlyStats>()
}

function toClickHouseDateTime(date: Date): string {
  return date.toISOString().replace('T', ' ').slice(0, 19)
}
Avoid string interpolation (WHERE type = '${userInput}').
Step 5: Streaming Large Result Sets
When you need to export raw events rather than aggregated tables (data exports, audit logs, etc.), it's better to use result.stream(). Loading millions of records into memory at once can cause OOM errors.
// Express route example
import { Router, Request, Response } from 'express'
import { clickhouse } from '../db/clickhouse'

const router = Router()

router.get('/export/events', async (req: Request, res: Response) => {
  const { from, to } = req.query

  if (typeof from !== 'string' || typeof to !== 'string') {
    res.status(400).json({ error: 'from and to parameters are required' })
    return
  }

  const resultSet = await clickhouse.query({
    query: `
      SELECT event_id, user_id, event_type, page_url, timestamp
      FROM analytics.events
      WHERE timestamp BETWEEN {from: DateTime} AND {to: DateTime}
      ORDER BY timestamp
    `,
    query_params: { from, to },
    format: 'JSONEachRow',
  })

  res.setHeader('Content-Type', 'application/x-ndjson')
  res.setHeader('Transfer-Encoding', 'chunked')

  for await (const rows of resultSet.stream()) {
    for (const row of rows) {
      res.write(JSON.stringify(row.json()) + '\n')
    }
  }

  res.end()
})
By reading in chunks and immediately piping to the HTTP stream, memory usage stays constant.
Pros and Cons
When ClickHouse Shines
| Item | Details |
|---|---|
| Overwhelming query performance | Scans hundreds of millions of rows per second on a single core; GROUP BY on hundreds of millions of records returns in hundreds of milliseconds using pre-aggregated tables |
| High compression ratio | LZ4 and ZSTD supported by default; 3–10x compression compared to original data reduces storage costs |
| High insert throughput | Combined with batch INSERTs, can handle millions of records per second |
| Simple deployment | Single binary, no external dependencies |
| Rich analytical functions | Built-in OLAP-optimized aggregation functions like quantile, topK, uniqHLL12 |
| Free and open source | Apache 2.0; no licensing cost for self-hosting |
Situations to Be Careful About
| Situation | Reason and Alternative |
|---|---|
| Frequent UPDATE/DELETE | Mutation operations rewrite entire parts. PostgreSQL is more suitable for these patterns |
| Multi-table JOINs | JOIN performance is a weak point. Pre-aggregating with denormalized wide tables or Materialized Views is preferred |
| Repeated small single-row INSERTs | Part count explosion, "Too many parts" error. Apply batch INSERT |
| ClickHouse Cloud costs | Offered in Basic/Scale/Enterprise tiers; pricing changes frequently, so check the official pricing page for the latest rates. For high-volume services, compare with self-hosting TCO |
Four Common Pitfalls in Practice
1. Choosing the wrong ORDER BY columns
If you only specify ORDER BY timestamp, a WHERE event_type = ? condition will result in a full table scan. If your primary query pattern is WHERE event_type = ? AND timestamp BETWEEN ? as in this example, ORDER BY (event_type, user_id, timestamp) is the right choice. The key point is that ORDER BY design must match the actual query patterns of your service.
2. Setting idle_socket_ttl incompatibly with the environment
If the client's idle_socket_ttl is higher than the load balancer's keepalive timeout, the server will close the socket first, causing intermittent errors. This type of issue is tricky to diagnose in production, so always check the load balancer's keepalive timeout during initial setup and set this value lower than that.
3. Interpolating user input directly into query strings
// Vulnerable to SQL injection
query: `SELECT ... WHERE type = '${userInput}'`

// Safe: binding via query_params
query: `SELECT ... WHERE type = {type: String}`,
query_params: { type: userInput }
4. Existing data not being aggregated after creating a Materialized View
CREATE MATERIALIZED VIEW ... AS SELECT ... only applies to data INSERTed after creation. Data already in the events table will not be reflected in the MV. To populate the aggregation table with existing data, you must manually run a backfill INSERT after creating the MV.
-- Manually backfill existing data after MV creation
INSERT INTO analytics.events_hourly_agg
SELECT
    event_type,
    toStartOfHour(timestamp) AS hour,
    countState()             AS event_count,
    uniqState(user_id)       AS unique_users
FROM analytics.events
GROUP BY event_type, hour;
Closing Thoughts
Ultimately, ClickHouse solves one thing: the analytical query bottleneck for "write once, read many" event data. If PostgreSQL is sufficient for your needs, there's no reason to add to your stack. But once your events table starts exceeding tens of millions of rows and aggregation queries feel sluggish, the Materialized View + AggregatingMergeTree path can transform queries that took tens of seconds into ones that return in hundreds of milliseconds.
Here are the key takeaways:
- MergeTree's
ORDER BYis your query performance. Designing it to match theWHEREconditions of your actual analytical queries is the most important thing. - The Materialized View + AggregatingMergeTree combination is the core pattern for real-time aggregation APIs. Millisecond responses are possible because you're querying the aggregation table instead of the raw data.
- Without batch INSERTs, you will hit part explosion in production. Apply the 2-second or 5,000-record buffering pattern.
- Binding inputs via
query_paramsis the security baseline. String interpolation is vulnerable to SQL injection. - MVs only apply to INSERTs made after creation. Existing data requires a manual backfill.
If you're starting now, here's a recommended sequence:
- Spin up a local ClickHouse with Docker and verify that
SELECT 1works via@clickhouse/client. You can be up and running in 30 seconds withdocker run -d -p 8123:8123 clickhouse/clickhouse-server. - Run the DDL above as-is to create the
eventstable,events_hourly_agg, and the Materialized View, then INSERT some dummy data. The moment you see the MV automatically populating the aggregation, the architecture will click into place. - Compare analytical query response times against your current PostgreSQL setup. If you have enough data, the difference will be immediately convincing.
References
- ClickHouse Official JavaScript Client Documentation
- clickhouse-js GitHub Repository
- ClickHouse Node.js Usage Example — Official Knowledge Base
- @clickhouse/client npm Package
- Async Insert Official Documentation
- MergeTree Engine Family Official Documentation
- Building StockHouse: Real-time market analytics with ClickHouse
- ClickHouse Materialized Views Guide (GlassFlow)
- ClickHouse Architecture Overview Official Documentation
- ClickHouse 2025 Annual Roundup
- Real-Time Analytics Database Selection Guide 2026
- Alibaba Cloud — Deep Dive into MergeTree Storage Structure